Superluminal Performance v1.0.4873.1234

Superluminal Performance v1.0.4873.1234 | 89 MB | Language: English
[spoiler]
Superluminal has been built for scale from the ground up. You can record a few frames of data, or you can record a few hours of data – it’s all the same to us. Superluminal will remain stable, with low memory usage, while showing you your profiling data in a smooth and fast 60 FPS UI. Want to see CallGraph data for a specific bad performing piece in the timeline? Select a time range in the timeline view and all views will filter to that specific section in constant time – whether you’re selecting the entire range or a second somewhere in the middle of a huge capture.
Visual UI
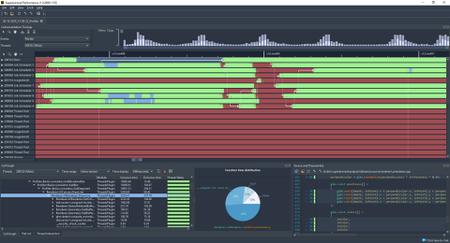
Traditionally reserved for instrumenting profilers, Superluminal is the only sampling profiler that displays the profiling data in a visual UI. Sampling data is displayed on a timeline, which allows you to see exactly, per thread, what function is being called when, what functions are being called around it and in what order. This gives you an unprecedented understanding of what’s happening in your program; understand not just what’s being called, but more importantly, why it’s being called. Of course, like everything else in Superluminal, our UI is built for scale – it will remain smooth at all times, no matter how much data you’ve captured.
Sampling
Superluminal is a sampling profiler. This allows you to hit the ground running without the need to make any code modifications. After install, you’ll be gathering performance data in no time. A powerful property of sampling is that it allows you to capture data from all code running your system, not just yours. System processes, third party code, it’s all included.
High-frequency
Most profilers sample at 1KHz, which is not very useful if you’re working on high-performance applications like games, which need to run at 30 or 60 FPS. In contrast, Superluminal has a high-frequency sampling engine that samples at 8 Khz (Windows) or 10 kHz (Xbox One). The high sampling frequency allows you to capture all the interesting work that’s happening in your application.
Kernel level stacks
On Windows and Xbox One, Superluminal supports capturing kernel-level callstacks. This allows you to see exactly how the system calls you’re making traverse through the kernel. You’ll be amazed to see how a seemingly innocent system call will cause havoc, causing the kernel to page data in and out or locks system-wide mutexes. See exactly what happens at program startup and how DLLs are loaded and initialized.
[/spoiler]
Homepage: https://superluminal.eu/
DOWNLOAD LINKS:
https://k2s.cc/file/207e907898a31
https://nitroflare.com/view/8169D77FFCC6E63/Superluminal_Performance_v1.0.4873.1234.rar
https://uploadgig.com/file/download/3a9695A5e8362c34/Superluminal_Performance_v1.0.4873.1234.rar


